Beautiful irony, this French city is the queen of traffic jams!
- Published on 08/01/2025 8:35
- Modified on 23/09/2025 14:00
TomTom, the leading specialists in geolocation technologies, publishes the 14th edition of its Traffic Index.
This annual report from TomTom analyzes congestion and traffic trends in 500 cities across 62 countries. This year, a revised methodology redefines the studied urban areas, while the data comes from 600 million navigation systems that traveled 732 billion kilometers in 2024.
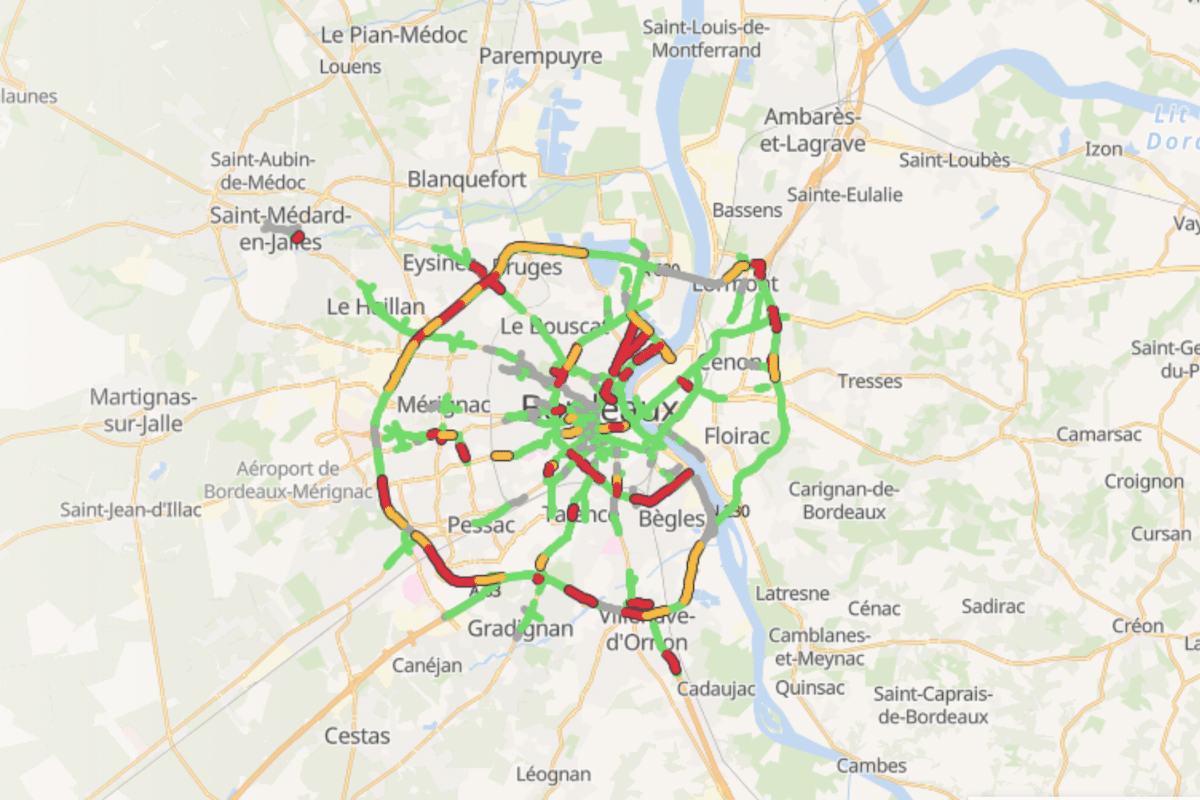
Among the 500 cities analyzed, 379 (76%) show a decrease in overall average speeds compared to 2023, due to increased congestion, although speeds in optimal conditions remained stable. In France, only Le Mans and Metz experienced slight improvements. Lyon faced the biggest decrease, with an average speed dropping from 26.5 to 25.3 km/h, adding one minute for every 10 km traveled. In Paris, closures related to the Olympic Games and reduced speeds on the périphérique to 50 km/h did not push the capital into the top of the most congested cities. Bordeaux ranks highest, recording the slowest average speed (19.3 km/h), compared to 20.8 km/h in Paris.
Differences between cities result from static factors (infrastructure, urban planning, speed limits) and dynamic factors (strikes, accidents, construction). Weather conditions amplify these impacts. For example, on November 21, 2024, storm Caetano caused congestion in Nantes to jump to 92%, with an average travel time of 37 minutes for 10 km. Bordeaux experienced a similar record on March 29, with 35 minutes and 40 seconds, due to storm Nelson combined with Easter departures.
The Traffic Index from TomTom highlights the importance of these variables in the evolution of urban mobility worldwide.
Average travel time for 10 km in 2024
| In France | 2024 | Worldwide | 2024 | |
| Bordeaux | 31 min 08 sec (19.3 km/h) | Barranquilla | 36 min 06 sec (16.6 km/h) | |
| Paris | 28 min 53 sec (20.8 km/h) | Calcutta | 34 min 33 sec (17.4 km/h) | |
| Marseille | 27 min 14 sec (22.0 km/h) | Bangalore | 34 min 10 sec (17.6 km/h) | |
| Nice | 25 min 29 sec (23.5 km/h) | Pune | 33 min 22 sec (18 km/h) | |
| Nantes | 25 min 06 sec (23.9 km/h) | London | 33 min 17 sec (18 km/h) |
Average congestion level in 2024
| In France | 2024 | 2023 | Worldwide | 2024 | 2023 | |
| Bordeaux | 33 | 32 | Mexico City (MEX) | 52 | 47 | |
| Avignon | 32 | 31 | Bangkok (THAI) | 50 | 48 | |
| Brest | 32 | 29 | Davao City (PHIL) | 49 | 49 | |
| Nantes | 32 | 31 | Kumamoto (JAP) | 49 | 49 | |
| Toulon | 31 | 30 | Bucharest (ROM) | 48 | 46 |
Average time lost due to congestion during peak hours in 2024
| In France | 2024 | 2023 | Worldwide | 2024 | 2023 | |
| Bordeaux | 113 hours | 115 hours | Lima (PER) | 155 hours | 137 hours | |
| Paris | 101 hours | 104 hours | Dublin (IRL) | 155 hours | 150 hours | |
| Nantes | 96 hours | 95 hours | Mexico City (MEX) | 152 hours | 140 hours | |
| Marseille | 93 hours | 89 hours | Bucharest (ROU) | 150 hours | 145 hours | |
| Nice | 84 hours | 78 hours | Kumamoto (JAP) | 149 hours | 153 hours |
Access the full city-by-city report here: www.tomtom.com/TrafficIndex
ALSO READ: Parisians waste fortunes in traffic jams
This page is translated from the original post "Belle ironie, cette ville française est la reine des bouchons !" in French.
We also suggestthese articles:
Also read